![]()
![]()
![]()
![]()
|
|
|
|
|
The HTML Active functionality provides a wide range of highlighting, sorting, filtering, calculation, charting, visualizing, column hiding or freezing, record listing, commenting, export, and print options for any Reserve Funding report.
To access the HTML Active functionality for a report:
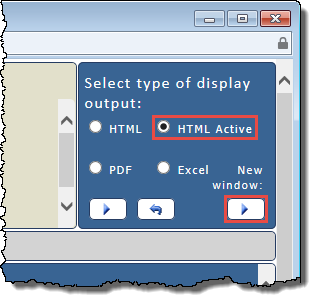
The HTML Active version of the report opens in a new window.
 Value/row functionality
To use the HTML Active report value/row functionality:
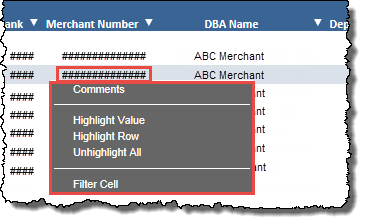
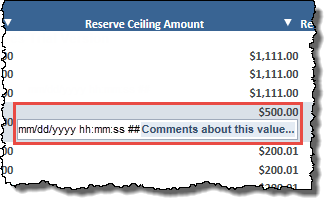
CommentsOpens the Add Comment box allowing you to add a comment about the value you clicked.
To add a comment to a value in the report:
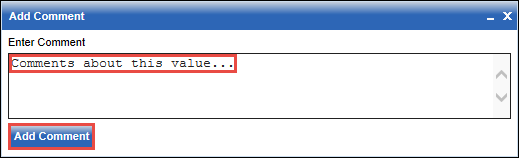
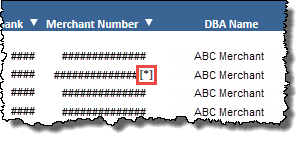
The Add Comment box closes and the value you added the comment to is identified with an asterisk (*) in the report display.
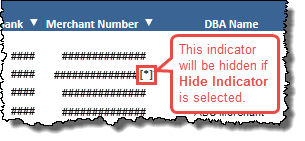
Tip: To change the way values with comments are displayed in the report, at any column heading, click the down arrow icon ![]() to open the HTML Active column feature menu, and then use the Comments sub-menu.
to open the HTML Active column feature menu, and then use the Comments sub-menu.
Opens a sub-menu allowing you to click an option to specify how values with comments are displayed in the report:
Highlight ValueHighlights every row containing the column value you clicked.
Highlight RowHighlights the row you clicked.
Unhighlight AllUnhighlights all highlighted rows.
Filter CellFilters the report to display only those rows containing the value you clicked, removing any previous Filter Cell function you applied.
Once a Filter Cell function is applied, the Remove Cell Filter option becomes available in the HTML Active row feature menu, which you can click to remove the Filter Cell function.
Remove Cell FilterThis option becomes available once a Filter Cell function is applied. It removes the applied Filter Cell function.
Column functionalityTo use the HTML Active report column functionality:
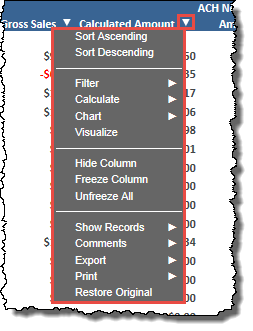
Sort AscendingSorts the column in ascending order.
Sort DescendingSorts the column in descending order.
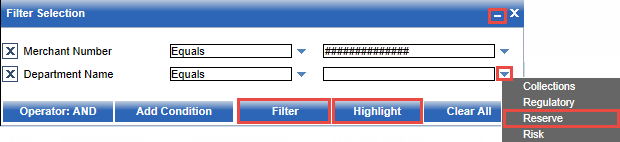
FilterOpens a sub-menu allowing you to filter the report based on values in the column.
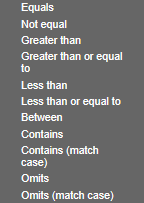
These options allow you to select criteria, specify operators, and add conditions to build your filter.
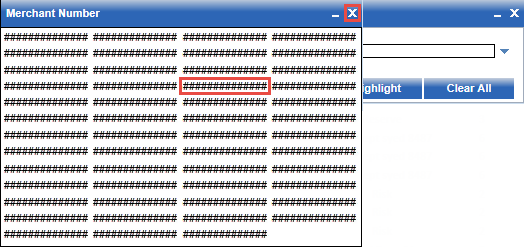
For example, if your report includes a Merchant Number and a Department Name column, and you want to filter the report to list only the results for a specific merchant number and department:
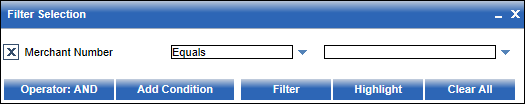
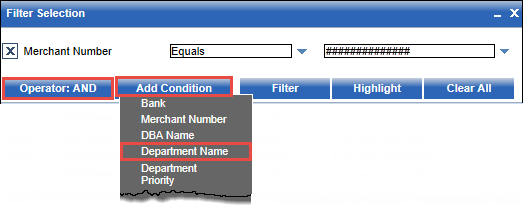
-or-
Click Highlight just to highlight the rows to which your filter applies.
Tip: To minimize the Filter Selection box, click the minus icon to replace it with the Filter Selection icon ![]() , which you can click to re-open the box.
, which you can click to re-open the box.
CalculateOpens a sub-menu allowing you to perform calculations based on the values in the column.
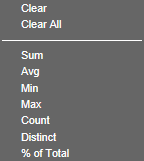
The calculations available are:
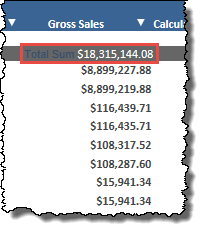
For example, if your report includes a Gross Sales column, and you want to calculate the total sum of the gross sale amounts listed, and indicate what percentage of the total sum each gross sales amount represents:
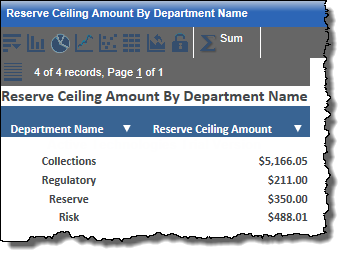
The report page refreshes to include the Total Sum at the top of the Gross Sales column.
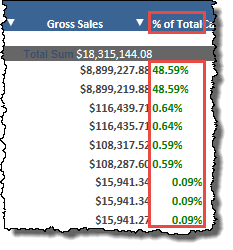
The report page refreshes to include an adjacent % of Total column indicating what percentage of the total sum amount each gross sales amount represents.
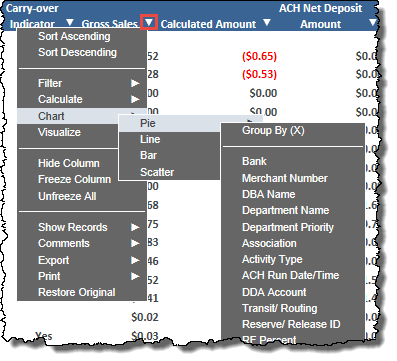
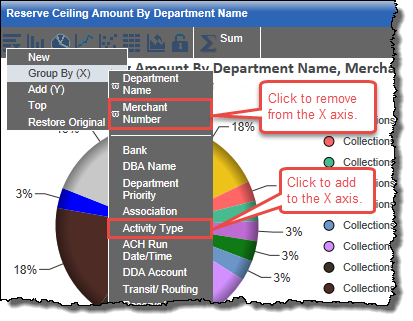
ChartOpens a sub-menu allowing you to create a chart based on the data listed in your report.
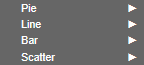
Note: The Scatter option is only available if the column you first select (that is, whose data you will use as the Y axis) lists numeric data.
To create a chart based on the data listed in your report:
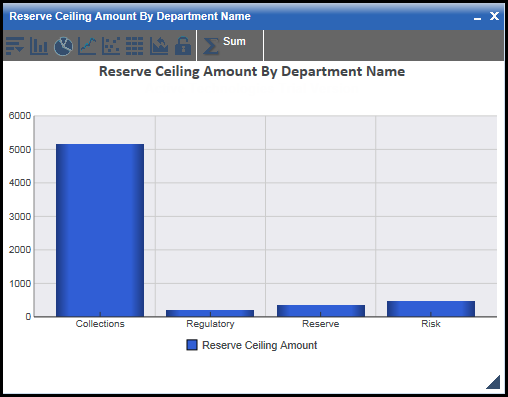
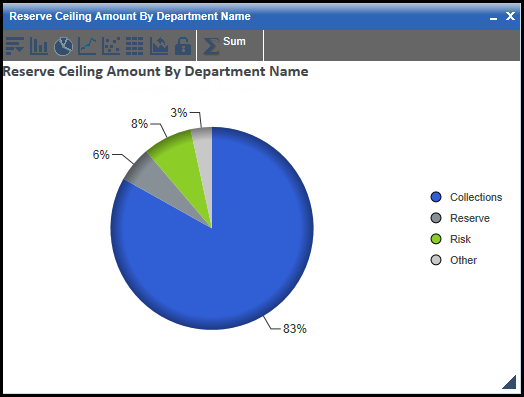
A box opens displaying your chart. Here is an example of a pie chart:
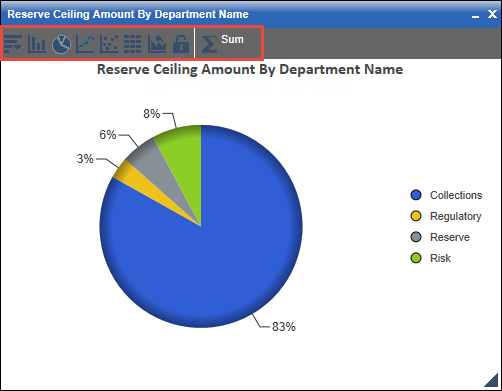
You can click the icons in the chart toolbar to perform various functions.
The chart toolbar, located as in the image below, enables you to perform various functions.
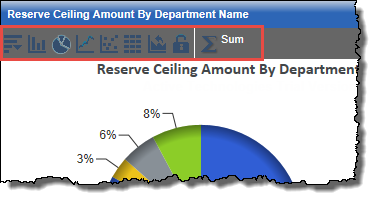
The toolbar provides these icons:
Opens a menu providing these options:
Click this to render the chart as a bar chart.
Click this to render the chart as a pie chart.
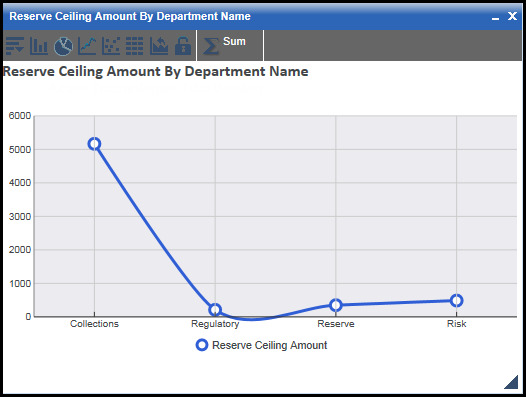
Click this to render the chart as a line chart.
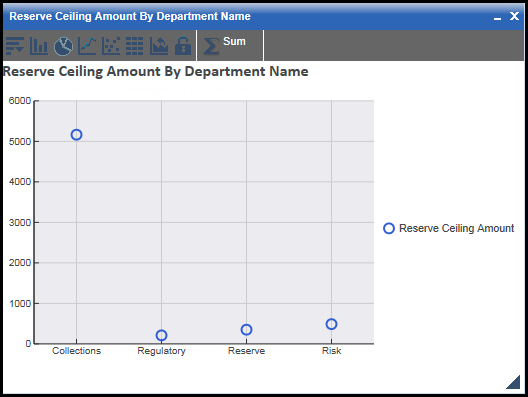
Click this to render the chart as a scatter chart.
Click this to render the chart as rollup information.
Click this to restore the original chart, removing any edits you made.
Click this to set the current chart as the original chart, which you can then return to later after making edits by clicking the Original Chart icon ![]() .
.
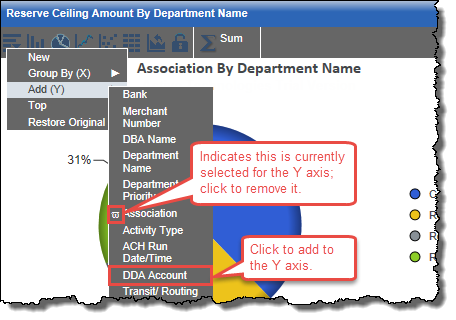
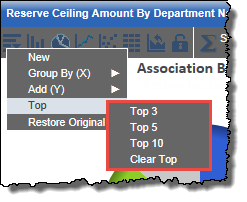
Opens a menu allowing you to select one of these options to refresh the chart with a recalculated Y axis:
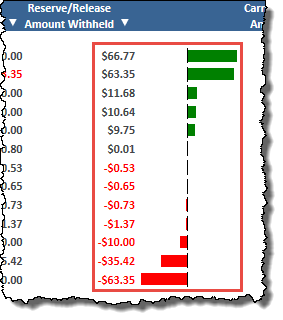
VisualizeThis option is available for columns containing numeric data values. It adds a graphic representation of each value in the column.
Hide ColumnHides the column.
To redisplay a hidden column, use the Show Columns sub-menu.
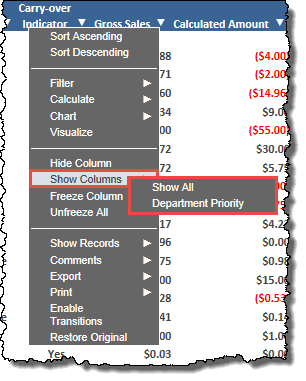
Show ColumnsOpens a sub-menu allowing you to redisplay any hidden columns.
To redisplay a hidden column, at any column heading, click the down arrow icon ![]() to open the HTML Active column feature menu, and then from the Show Columns sub-menu, click the hidden column name, or click Show All to redisplay all hidden columns.
to open the HTML Active column feature menu, and then from the Show Columns sub-menu, click the hidden column name, or click Show All to redisplay all hidden columns.
Freeze ColumnFreezes the report columns in the window from the left of the report to this column, and provides a scrollable section within the window for the remaining columns to the right of this column.
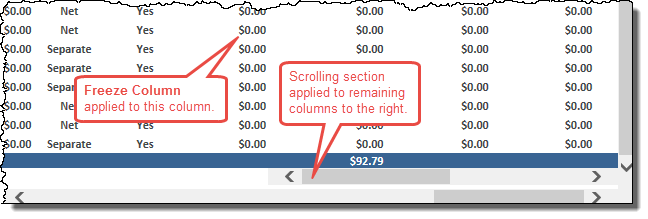
To unfreeze the column, use the Unfreeze All menu option.
Unfreeze AllRemoves any Freeze Column functionality applied to a column.
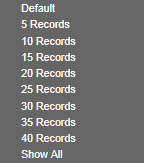
Show RecordsOpens a sub-menu where you can click an option to specify the number of records listed per page, or click Default to list the default 50 records per page (which you can then page through), or click Show All to list all the records on one page (which you can then scroll vertically through if necessary).
CommentsOpens a sub-menu allowing you to click an option to specify how values with comments are displayed in the report:
Tip: You can add a comment to a value in a row by clicking it to open the HTML Active row feature menu and then using the Comments option.
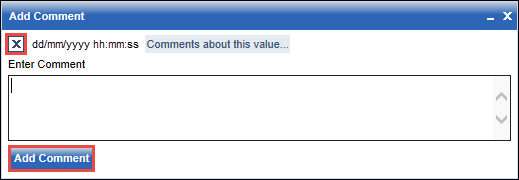
Opens the Add Comment box allowing you to add a comment about the value you clicked.
To add a comment to a value in the report:
The Add Comment box closes and the value you added the comment to is identified with an asterisk (*) in the report display.
Click the x icon for the existing comment, and then click the Add Comment button.
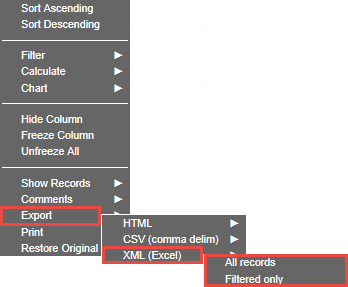
ExportOpens a sub-menu allowing you to export all the report records or just the filtered ones in HTML, Comma Separated Value (CSV), or Excel (XML) format.
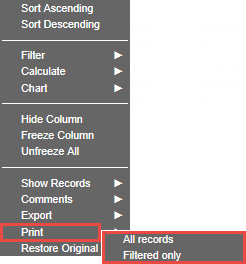
PrintOpens a sub-menu allowing you to print all the report records or just the filtered ones.
Restore OriginalRestores the report display to its original state, removing any sort, filter, hidden column, freeze column, and comment functionality applied.